


 Search

 Call: 074-2915208
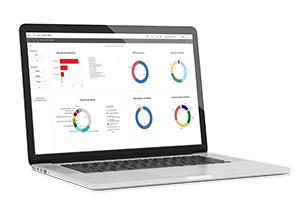
If you regularly create charts and tables in Excel to display information in a beautiful way, you have certainly invested a lot of time in this. To save time, Wolters Kluwer has built the Analytics module. This allows you to analyze the situation quickly and easily based on data from Alure.
This is because Alure is a business intelligence dashboard that displays standardized reports in graphs and tables. You can also create new insights in production, marketing, HR and finance. Because the module works quickly and easily, it shows better connections than Excel.
This is because Alure is a business intelligence dashboard that displays standardized reports in graphs and tables. You can also create new insights in production, marketing, HR and finance. Because the module works quickly and easily, it shows better connections than Excel.
In collaboration with Victa, Alure has developed a module based on Qlik, called Alure Analytics. With Alure Analytics you gain insight into all important data within Alure. The graphs in Alure Analytics can be easily exported. That is why this module in the ERP software is the addition to further professionalize your organization. The Alure Analytics module also makes it possible to display reports in clear graphs and tables. It provides insight into work in progress, billable costs, invoicing, outstanding items and employees.
Watch the video here
Why Alure Analytics?
- Analyzing data and creating standard reports often takes a lot of extra time
- Excel finds it difficult to guarantee consistency and quality of management information
- Specialist knowledge is required to realize custom BI models
- Always and everywhere the correct management information from Alure at hand because Alure Analytics is mobile ready